


-
OCT 22, 2025

UNLOCKEDDepartment of Buildings – BGA Policy 2026 Budget Snapshot
Table of contents
Departmental Highlights
Snapshot: Appropriation & Staffing Changes from 2025 Budget
2025 Budgeted 2026 Proposed Net Change Percent Change Average Annual Rate of Change (2011-2025) Inflation-adjusted Rate of Change (2011-2024) Appropriations $39,704,856 $39,368,782 -$336,074 -0.8% 1.1% -1.0% Positions & FTEs 280 279 -1 -0.4% -0.9% NA - The building department’s budget and headcount have remained relatively stable for many years, with headcount declining slightly and appropriations slightly trailing inflation.
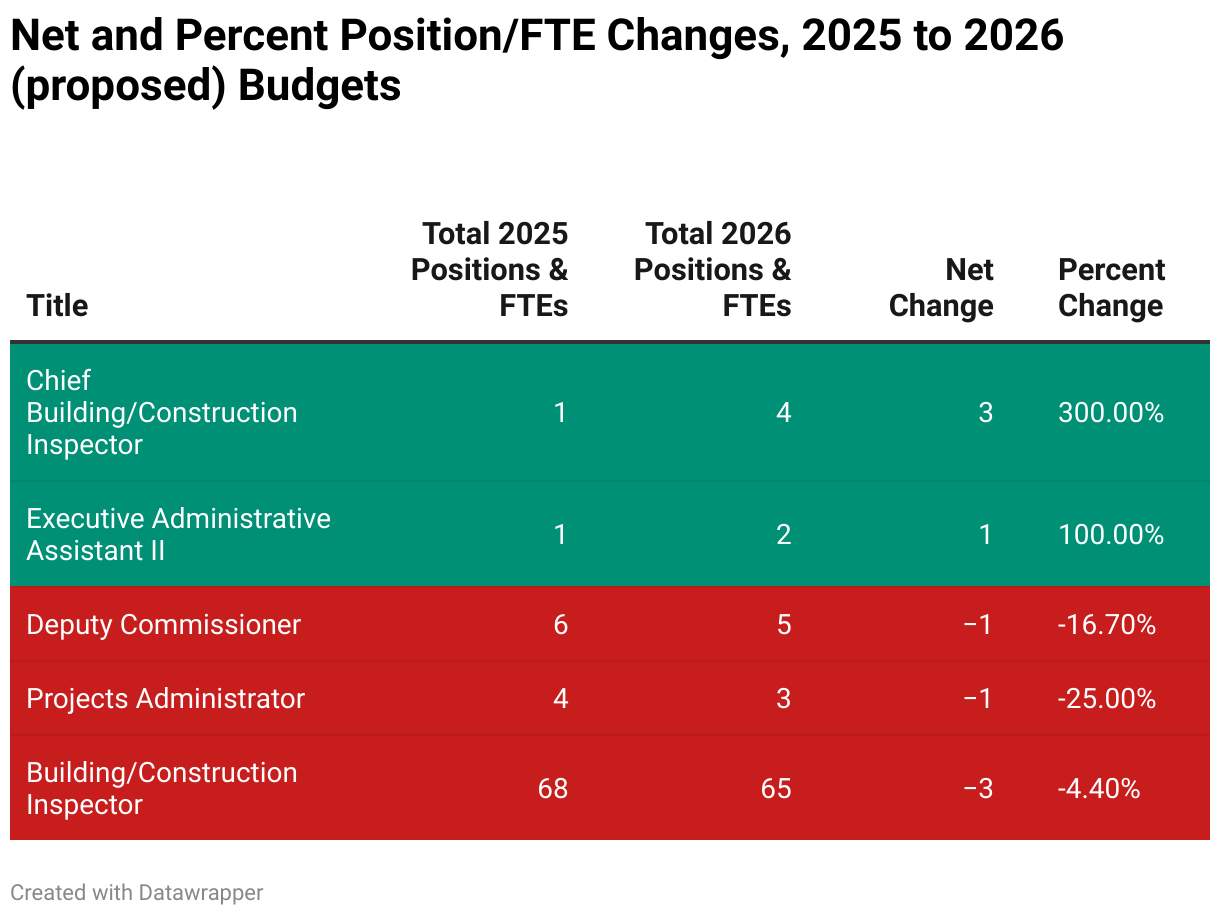
- DoB’s budgeted positions saw relatively minimal changes, with retitling three building/construction inspector titles to Chief Building/Construction Inspector and the elimination in one of six Deputy Commissioner positions the largest shifts.
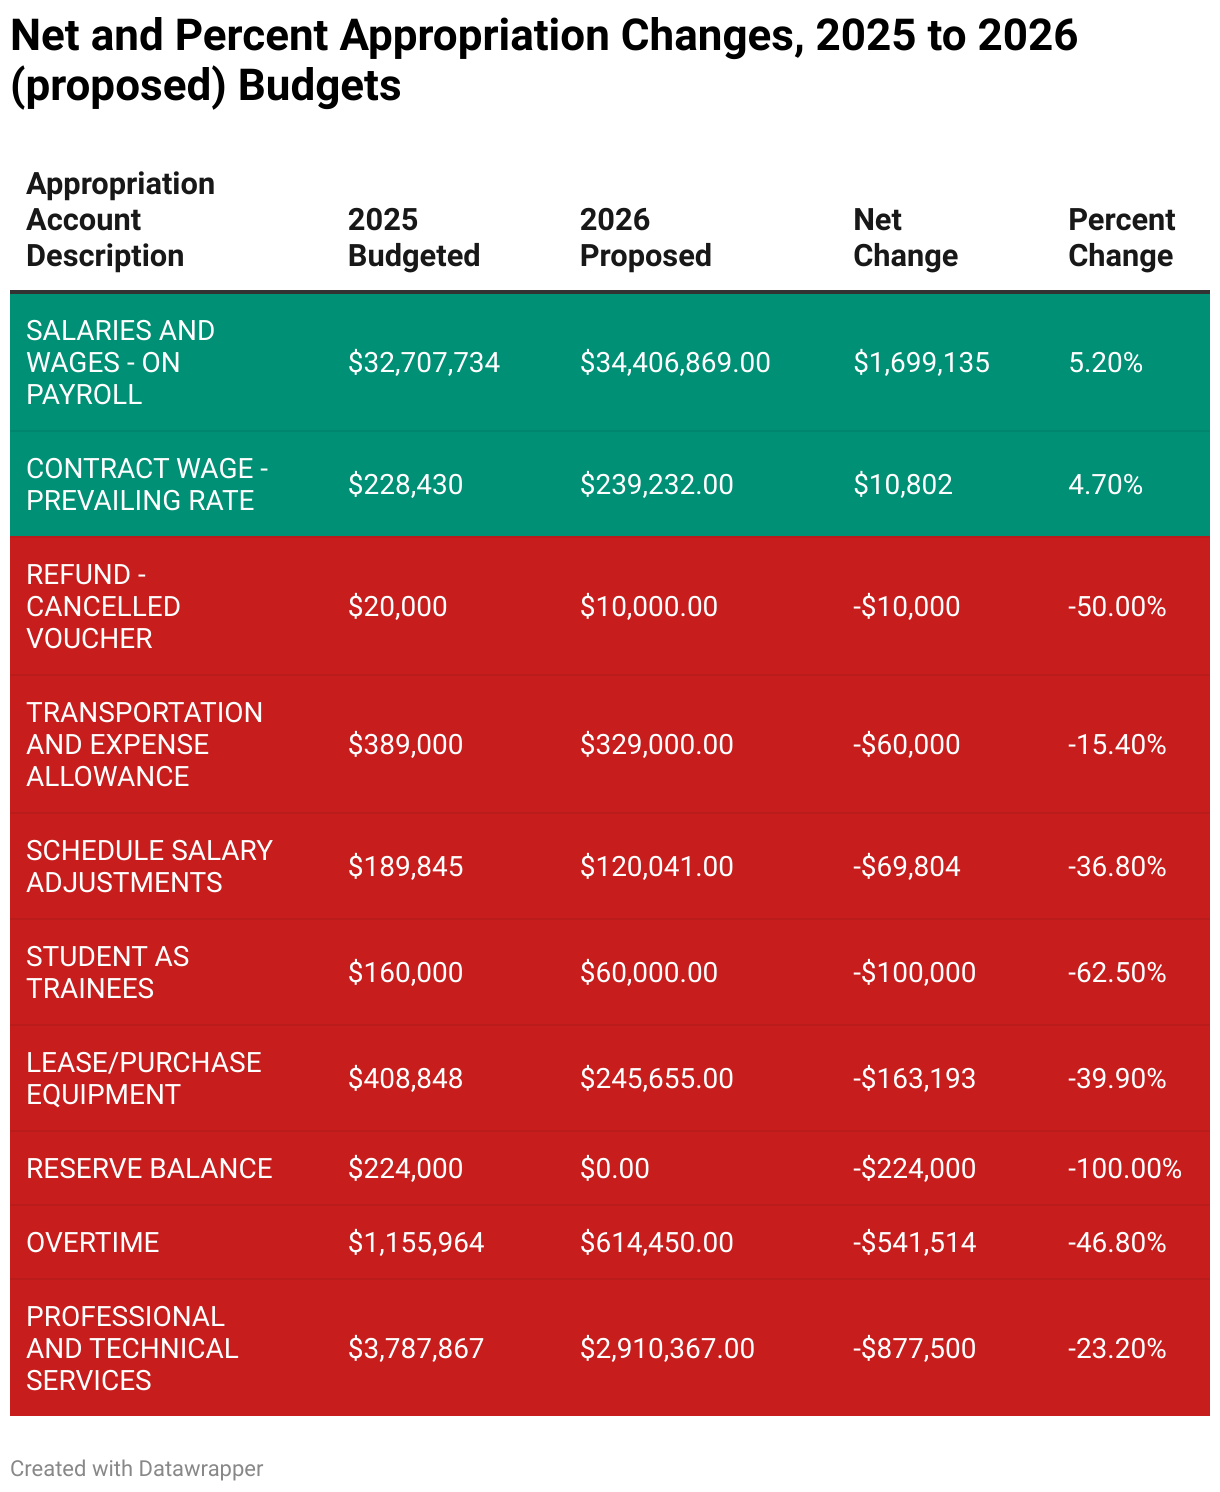
- The changes to DoB’s previous year budget were relatively small, with an additional $1.7 million (5.2%) in salaries and wages the largest increase, and a -$877,500 (-23.2%) change in professional and technical services the largest decrease.
Historical Context
DoB’s total appropriations have risen at an average annual rate of 1.1% from 2011-2025, an inflation-adjusted decline of -1%, compared to a citywide average rate of 8.3% (inflation-adjusted 4.4%).

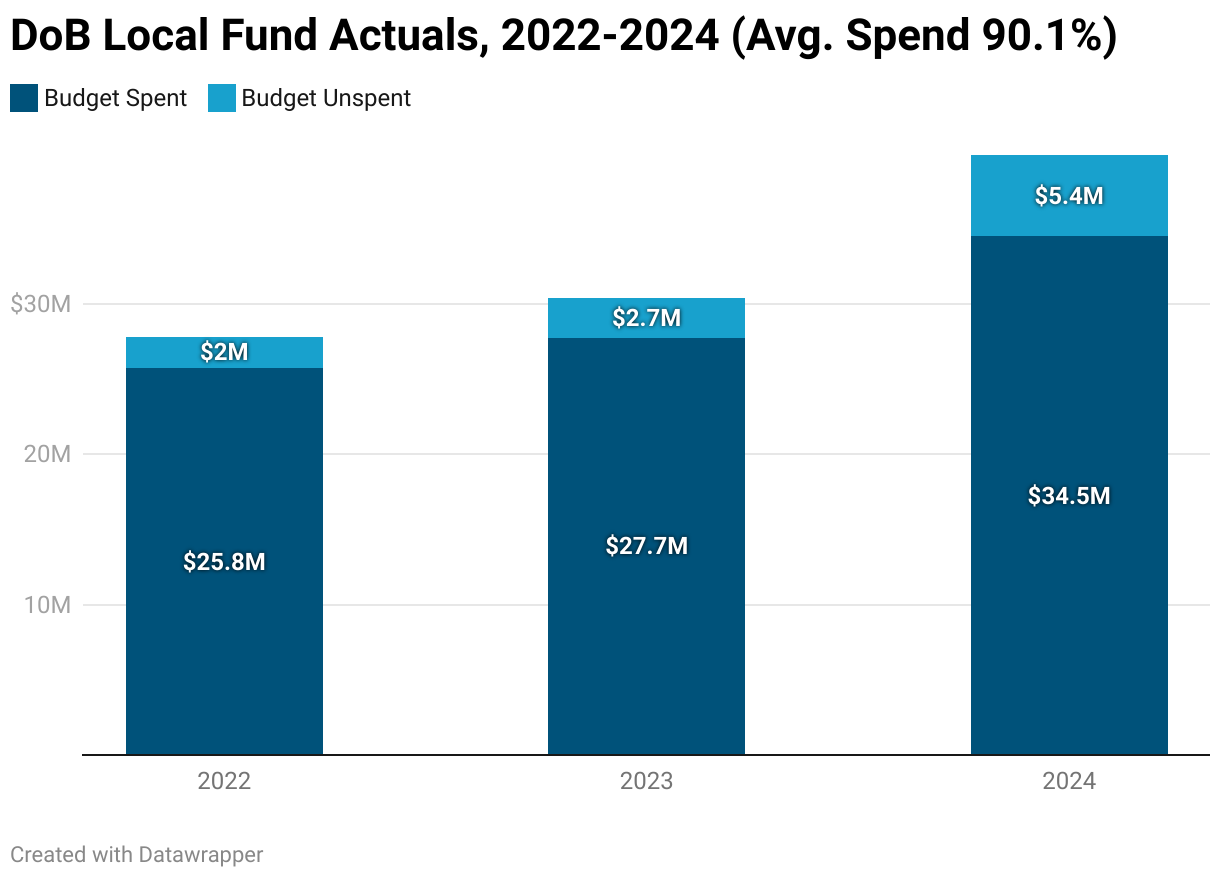
Over the past three complete budget years for which local fund actuals/encumbrances data is available, DoB spent on average 90.1% of its locally funded budget, compared to the citywide average 86.4% local fund spend.
Budgeted positions at DoB have declined at an average annual rate of -0.9% annually from 2011-2025, compared to a citywide average annual change of -0.1%.

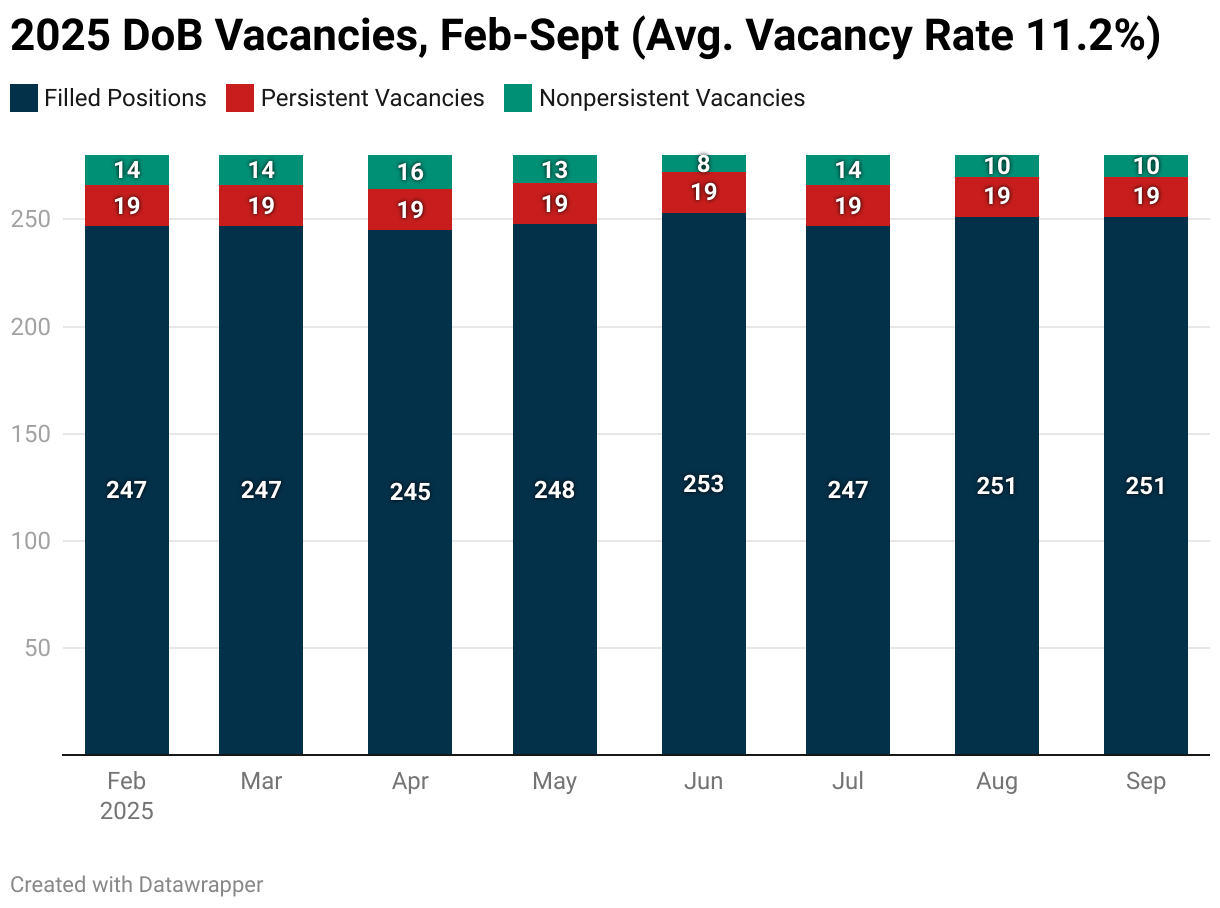
From February through September of 2025, the months for which the city released full-time position vacancy data, DoB averaged an 11.2% vacancy rate, the same as the citywide average of 11.2%.
19 of the department’s budgeted full-time positions were persistent vacancies, meaning that the same title/division/section/subsection combination was vacant for all eight months of available data.
Staffing
DoB’s budgeted positions saw relatively minimal changes, with retitling three building/construction inspector titles to Chief Building/Construction Inspector and the elimination in one of six Deputy Commissioner positions the largest shifts.
Appropriations
The buildings department is fully locally-funded in this year’s budget proposal, having lost the small amount of federal grant funding that was included in its 2025 budget.
Most of the department’s appropriations come from the corporate fund, with smaller amounts from the water, sewer, and vehicle tax funds.
Fund 2025 Budgeted 2026 Proposed Net Change from 2024 Percent Change from 2025 Percent of 2026 Funds Corporate Fund $32,127,244 $31,568,436 -$558,808 -1.7% 80.2% Water Fund $4,390,459 $4,434,238 $43,779 1.0% 11.3% Sewer Fund $2,336,590 $2,693,032 $356,442 15.3% 6.8% Vehicle Tax Fund $626,563 $673,076 $46,513 7.4% 1.7% Federal Grant Fund $224,000 $0 -$224,000 -100.0% 0.0% Largest Appropriations
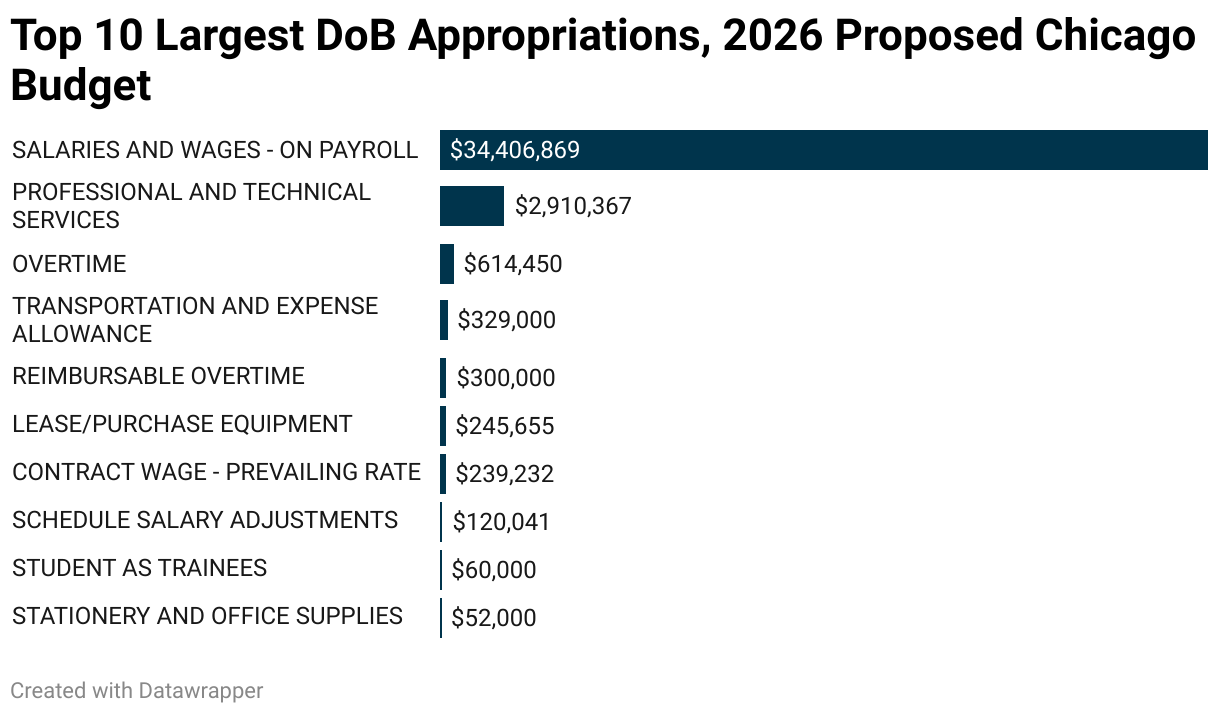
As with most other departments, salaries and wages on payroll is by far the largest appropriation category for the buildings department, with all other categories substantially smaller in comparison.
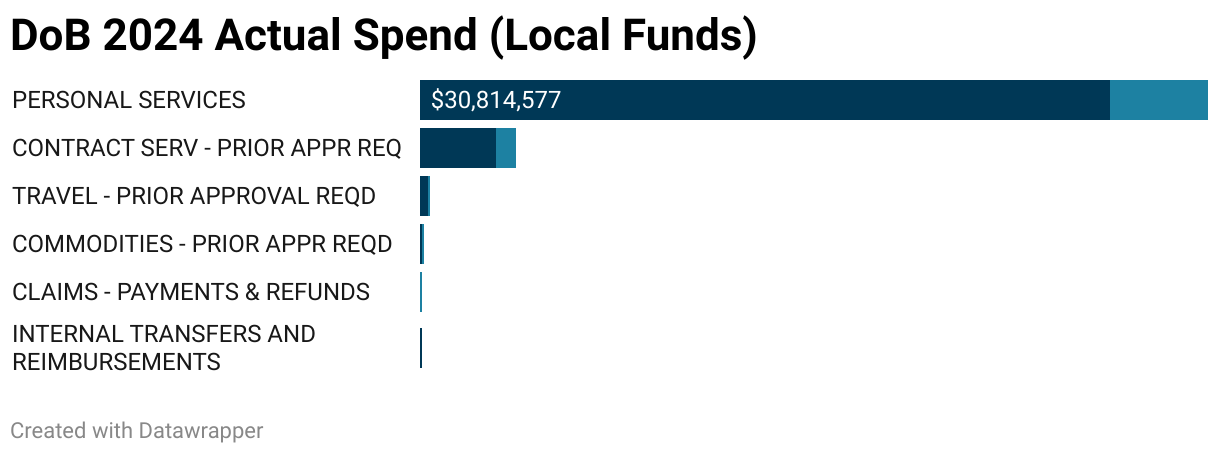
In 2024, the most recent year for which actuals and encumbrances data is available, DoB spent 87.7% of its personnel services funds, and 86.5% of its funds overall. (Because the appropriation categories used in the 2022-2024 actuals datasets from the Department of Finance do not correspond exactly to the appropriation accounts used in the budgets presented by the Office of Budget and Management, an exact line-by-line comparison of real spend to budget is not possible.)
Change from Previous Year
The changes to DoB’s previous year budget were relatively small, with an additional $1.7 million (5.2%) in salaries and wages the largest increase, and a -$877,500 (-23.2%) change in professional and technical services the largest decrease.
This article first appeared on Better Government Association and is republished here under a Creative Commons Attribution-NoDerivatives 4.0 International License.


Sponsored content

Trending
Housing committee to consider QAP standards changes, Missing Middle sales
Fintech entrepreneur making outsider bid for Chicago mayor
Quigley enters mayor’s race, promising to distinguish as candidate not burdened by future ambitions
Mayor responds to organizers’ call for dedicated city gun violence reduction agency
Mayor proposes $425M in TIF assistance for public infrastructure at The 78 development
What makes up the mayor’s sweeping Residential Landlord and Tenant Ordinance modernization

